[Next] [Previous] [Top] [Contents]
Towards a Descriptive Model of Agent Strategy Search - Bruce Edmonds
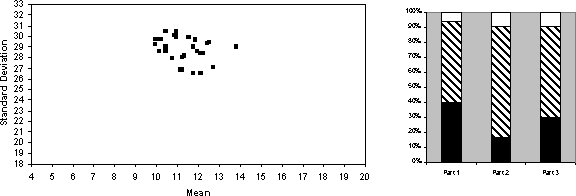
For ease of reference the two `signature' graphs of the target behaviour are shown in Figure 2 below. The first is a rescaled version of Figure 1 and the second is a barchart showing the average proportion of times that subjects earlier than the optimal, at the optimal point and after the optimal point for parts 1, 2 and 3. Please note that whereas Sonnemans' calculated the expected average earnings and spread of earnings using 160,000 simulations of randomly generated games, I had only the computational resources to do relatively few (400 simulations). Thus while the diagram in [2] are accurate to one decimal place (with a probability of 95%), mine are only accurate to the nearest 1 (in the mean earnings), and will overestimate the expected spread of the earnings.
Figure 2: Two `signature' graphs of Sonnemans' results [12]. The first is a plot of the standard deviation of net earnings against the mean of those earnings over 160,000 random games for the 32 strategies shown in Table 1. The second is the proportion of early, optimal and late stoppings for the 32 subjects for parts 1, 2 and 3, taken from Table 2. The black are is the early stopping proportion, the shaded the optimal and the white is the late.
The first three runs mimic the original GP algorithm (i.e. as described in [7]). That is, the proportion of operators was: 90% crossover and 10% propagation; evaluation of strategies was done primarily on net earnings but with a significant bias against syntactically complex strategies; the strategies were allocated a final fitness depending on their score in the evaluation; the initial population of strategies was generated with a maximum depth of 3; and the strategies were evaluated over the previous two games each time. The three runs are with 10, 20 and 30 strategies respectively. The corresponding graphs are shown in below.
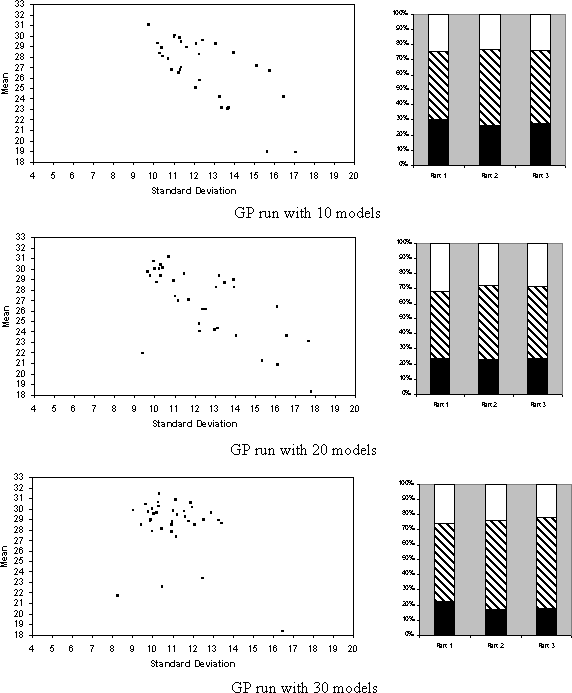
Figure 3: The `signature' graphs of the three GP runs*1.
As we can see from these results although the mean and spread of the earnings for the run with 30 models is approximately right (except that it is bit too evenly spread and there are a few stragglers with low mean) the stopping pattern is not. Unsurprisingly the GP algorithm is not biased towards stopping early. Also the set of strategies the algorithm finished with were not as complex as those of the experimental subject, in fact they were all of zero depth (i.e. involved only one predicate and no Boolean operators), they were: H>=68, L>=68, H>=86, L>=76, H>=84, L>=81, H>=78, E>=69, N>=10, L>=74, E>=74, H>=76, H>=77, E>=63, H>=82, E>=62, L>=74, E>=71, H>=78, E>=75, L>=79, H>=80, E>=71, E>=70, E>=41, H>=76, O>=4, E>=72, H>=74, H>=81, E>=69, H>=75, H>=88, H>=82, E>=54, and H>=75. It seems that this version of strategy search (unlike Sonnemans' subjects) quickly settles on search the combinatronic variations of numbers and single predicates. This explains the few `stragglers', who just happened not to have an appropriate combination in their initial population of expressions; there is no novelty or hill climbing in this run so they could never develop them.
I do not have enough space to describe all the runs, so I will now turn to the run that most closely matched Sonnemans' results. This was the best run I have achieved in terms of the level of qualitative fit. In this run: the agents had a population of 80 models generated with an initial depth of 1; the proportion of operators was 10% propagation, 2% election, 15% generalisation, 30% hill climb, 4% new, 5% specialisation, 20% cut and graft; the strategies were evaluated over the last 4 time periods in proportion to net earnings only but strategies deeper than and those that always incurred the maximum amount of cost were always removed.
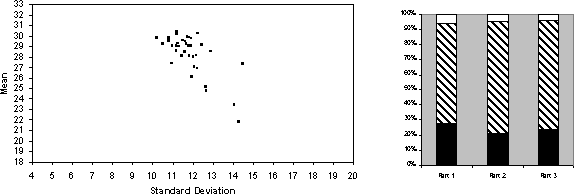
Figure 4: The run wit the most realistic search pattern
This run was closer on the stopping pattern but not completely realistic in the pattern of earnings and their spread - the more successful agent look realistic but there is a `tail' of unrealistically poor strategies with low average earnings. It did produce a more realistic mix of strategies in terms of a mix of depths.
The equivalent of Table 2 for this run is shown below in Table 3. The stopping pattern is similar except for the fact that for Sonnemans' subjects they exhibited the most optimal stopping behaviour in part 2 rather than part 3 as below. This may have been because in the original experiment the restricted information available to the subjects may have encouraged them not to recall previous highest bids but concentrate on the immediate one and thus improve their performance. This improvement in the absence of recall has been noted in previous experiments (e.g. [4]). the efficiencies of the subjects behaviour shows a similar pattern and can be attributed to the same reason.
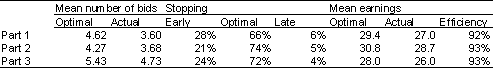
Table 3: The equivalent of Table 2 above for the best simulation run.
The equivalent of Table 1 is shown below for this simulation run (Table 4). Here we do see a variety of simple and complex strategies, and the average and standard deviation of the earnings achieved was close to that found by Sonnemans. What we do not see is the significant presence of strategies using primitives of the form Nxb3 x or Oxb3 x. It is likely that the bias against excessive cost might have the effect of removing these at an early stage.
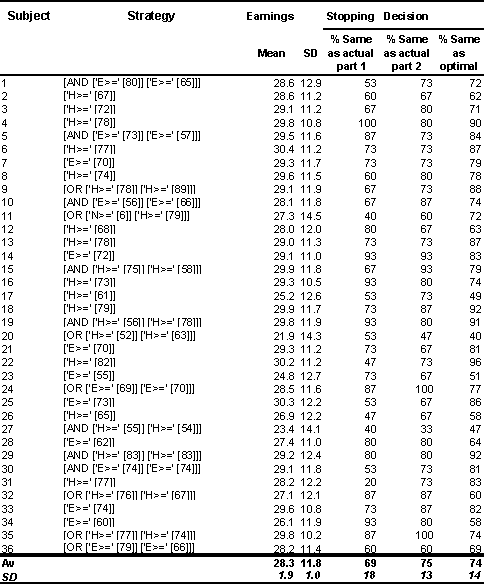
Table 4: The equivalent of Table 1 for the best run.
To summarise; the above model succeeds in simultaneously capturing several different aspects of the target behaviour. Of the aspects it does not capture, three stand out. I discuss these below.
If the run with the closest match is at all realistic it suggests the following pattern of agent strategy development:
[Next] [Previous] [Top] [Contents]
Generated with CERN WebMaker